Climate research runs on records, and records are harder to build than they look. On its face, an update to a dataset sounds like a minor event. The release of version 4.2 of the European Space Agency’s water-vapour products is worth a closer look, because it illustrates how the infrastructure of climate science is assembled, maintained and corrected over decades.
The update extends the record from 15 to 24 years, covering March 2000 to December 2023, and adds revised uncertainty information. It measures total column water vapour over land rather than rainfall at a particular location.
What the dataset actually measures
Total column water vapour is the amount of water in the atmosphere above a point, expressed as a depth. It is a measure of atmospheric moisture, not of precipitation. That distinction matters: a region can have high moisture and no rain, or receive rain from moisture that formed elsewhere. Researchers use the measurement to study the water cycle, atmospheric transport and the relationship between temperature and moisture.
Why longer is better
Short records are dominated by variability. A five-year dataset cannot easily distinguish a trend from a fluctuation, because natural cycles operate on similar timescales. Twenty-four years is long enough to begin separating long-term change from year-to-year noise, and long enough to compare conditions across different climate patterns. The value of the extension is statistical as much as it is temporal.
More than extra years
The update is not simply more of the same. The four products combine observations from several satellite instruments and offer daily or monthly data at two grid resolutions. Revised uncertainty estimates, quality flags and information about which observations contributed to each value accompany the measurements. Those details are what allow a user to judge whether a given value is robust or marginal.
A dataset without uncertainty information invites misuse. If a user cannot tell whether a difference between two periods is meaningful, they may read noise as signal. Providing uncertainty estimates and quality flags is part of making the data scientifically usable. This is a principle that applies across climate science, and it is unevenly followed.
Combining instruments is hard
Different satellite instruments measure the atmosphere in different ways, at different times, with different biases. Merging them into a single consistent record requires careful calibration and correction, so that a change in instrument is not mistaken for a change in the atmosphere. This is painstaking work, and it is the core of what a climate data initiative does. The alternative, a patchwork of incompatible observations, would be far less useful.
The project behind it
The work is part of ESA’s Climate Change Initiative, with the water-vapour project led by the University of Reading. The initiative’s purpose is to produce consistent, well-documented records for climate and water-cycle research. Its outputs are infrastructure: unglamorous, widely used, and largely invisible to the public.
It does not operate as a real-time weather service. The record ends in December 2023, and its purpose is research rather than forecasting. Anyone needing current conditions should look elsewhere. Confusing a climate record with a weather feed is a common error, and it leads to misplaced expectations about what the data can do.
How the merging works
Satellite instruments measure water vapour using different techniques and wavelengths, each with its own sensitivity and bias. To merge them, the project must characterise those differences, adjust for them, and assess how well the combined product performs against independent references such as ground-based measurements. The process is iterative: new instruments and new calibration knowledge lead to revised versions, which is why the dataset carries a version number rather than being fixed.
What the data is used for
Researchers use water-vapour records to study how moisture moves through the atmosphere, how it responds to warming, and how it relates to drought and heavy rainfall. Because water vapour is itself a greenhouse gas and a key part of the water cycle, it sits at the intersection of climate and hydrology. The record also supports the evaluation of climate models, which must reproduce observed moisture patterns to be credible.
Satellites measure the total column of water vapour, which combines the surface layer and the upper atmosphere. That is useful for many purposes and insufficient for others, such as understanding conditions at ground level. Cloud cover can interfere with some measurements, and the record over land is more difficult to produce than over ocean. The dataset’s documentation flags these limitations, and users are expected to read them before drawing conclusions.
The open-data argument
Releasing a climate dataset openly is a policy choice with consequences. It allows researchers anywhere to use the record without negotiating access, which widens the community that can test and build on it. It also exposes the data to criticism, including from people who disagree with the science. The open approach has largely won in climate research, on the view that transparency strengthens rather than weakens the evidence base. Datasets like this one are the practical expression of that principle.
This report draws on ESA Climate Change Initiative.
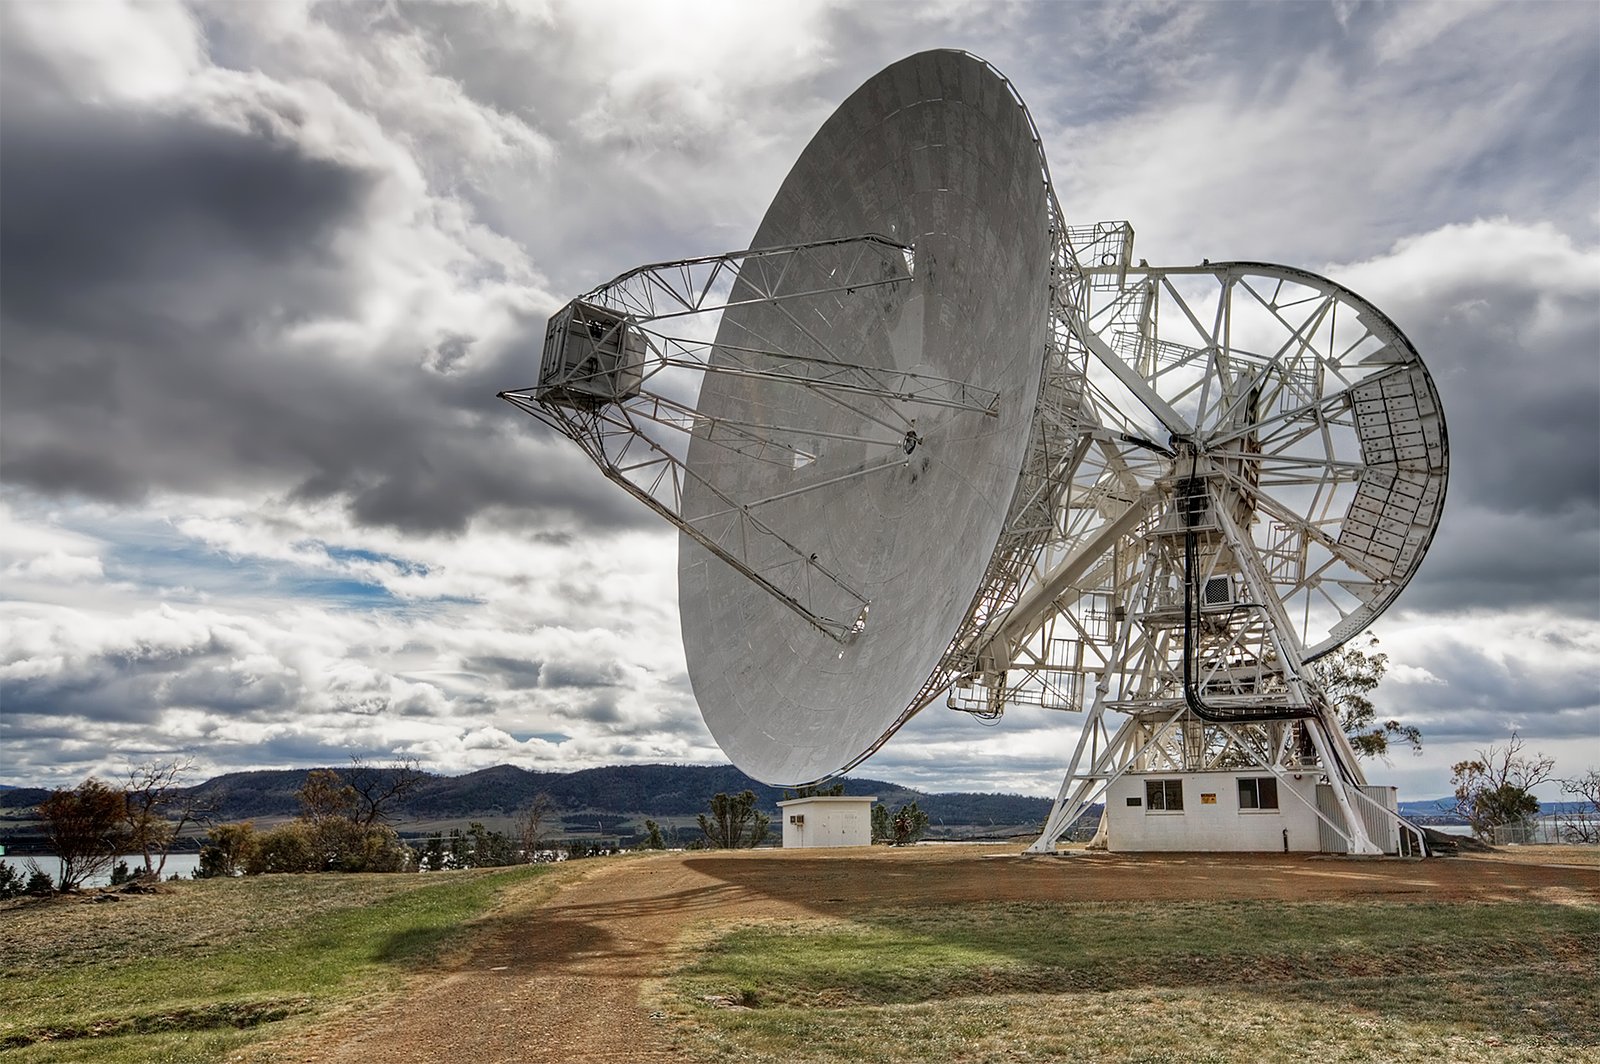
Image: Michael Trolove · CC BY-SA 2.0 · via Wikimedia Commons.