A map that covers a country sounds like a settled achievement, and the story behind it is one of coordination. On 3 September, the US Geological Survey said its cooperative national geologic map now covers all fifty states and US territories. Geologic maps describe rock, sediment and related features, and they inform questions about groundwater, mineral resources, infrastructure and natural hazards.
The milestone is about coverage, which is different from resolution and different from interpretation.
What a geologic map shows
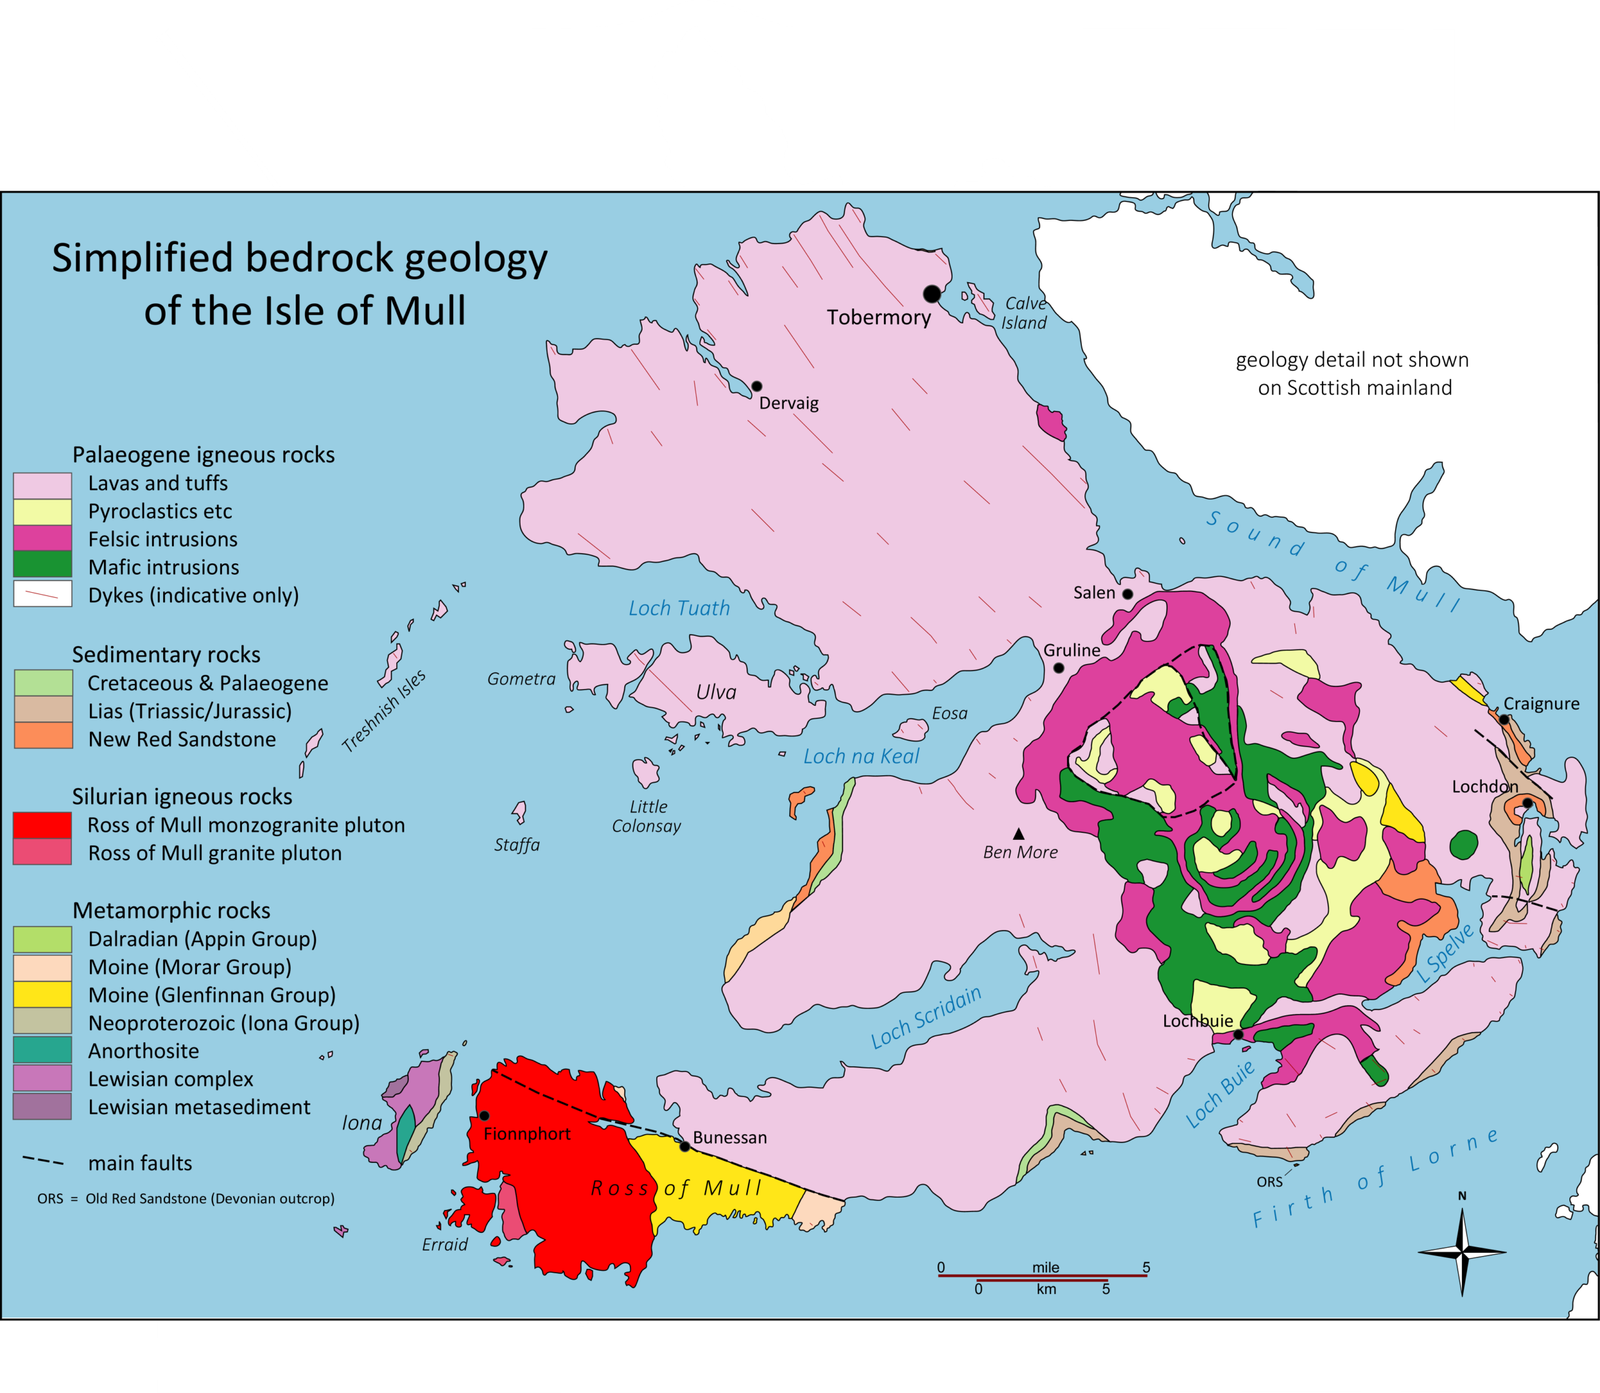
A geologic map records the distribution of rock units and sediments at or near the surface, along with structures such as faults. It is the product of fieldwork, drilling, geophysics and interpretation, and it varies in detail depending on how much work has been done in an area. A nationwide map assembled from state and federal efforts will be uneven, with some regions mapped in fine detail and others at a broader scale.
Why coverage matters
Without a common map, each state and agency uses its own conventions, which makes comparison across borders difficult. A national map establishes a shared framework, allowing data from different sources to be combined. That is valuable for regional planning, resource assessment and research, even where the underlying detail is coarse.
What it can be used for
Geologic maps support groundwater exploration, mineral and energy assessment, earthquake and landslide hazard analysis, and infrastructure siting. They are a reference rather than a decision: a map indicates what is likely, and a site-specific study confirms what is there. Confusing the two leads to expensive surprises.
The limits of resolution
Map coverage does not replace site-specific studies. Resolution and field evidence remain important, and a national map at a coarse scale cannot substitute for detailed local work. The documentation accompanying the map explains the scale and the limitations, and reading it is part of using the map responsibly.
How it was assembled
The map is described as cooperative, meaning it draws on work by state geological surveys, federal agencies and academic researchers. Coordination of this kind involves agreeing on standards, reconciling different data formats and filling gaps. It is an administrative and scientific achievement that rarely attracts attention, and it is foundational for many applications.
Who uses it
Users include planners, engineers, resource companies, researchers and emergency managers. Each has different needs and levels of expertise, which is why access tools matter as much as the data itself. A map that is difficult to find or interpret is less useful than one with clear documentation and interfaces.
Where to look next
Map documentation and access tools explain the scale and limits of the data. The questions worth following are whether the map is updated as new work is done, whether it is freely accessible, and whether it is used in decisions about land and resources. Coverage is the beginning of a resource that has to be maintained.
The digital access question
A map is only useful if people can find and understand it. Access tools, documentation and formats determine whether the data reaches planners and researchers or remains a specialist resource. Open publication of geological data has advanced in many countries, and the practical value depends on whether the interfaces are usable by non-specialists.
How maps are maintained
Geologic understanding changes as new fieldwork, drilling and geophysical surveys are completed. A map that is not updated becomes less accurate over time, and maintaining it requires ongoing investment. National mapping programmes often struggle to sustain updates once the initial coverage is achieved, because the political attention that funded the work moves elsewhere.
The economic value of geologic data
Geologic information supports decisions worth large sums: where to site infrastructure, where groundwater can be found, where minerals are located and where hazards exist. The economic value is difficult to measure because it is spread across many users and decisions. This makes the case for public funding harder to make than for a project with a visible output, even when the returns are substantial.
The international comparison
Several countries have national geologic mapping programmes, and their coverage and accessibility vary. Some publish detailed data openly; others restrict access or charge for it. Comparisons are difficult because scales and standards differ, and they reveal that a nationwide map is a milestone rather than an endpoint. The useful question is not whether a country has a map but how detailed, current and accessible it is.
The cost of not having good data
Where geologic information is poor, decisions are made with greater uncertainty, and the costs appear later as failed foundations, dry wells or unexpected contamination. These costs are borne by whoever builds or lives there, and they are rarely attributed to the absence of data. Making the case for mapping investment requires connecting it to those downstream costs, which is difficult because the link is indirect.
The international data question
Geological data is also relevant across borders, for shared aquifers, mineral deposits and seismic zones. International cooperation on data standards and sharing is uneven, and it is complicated by commercial and security interests. A national map is a building block for regional understanding, and its value increases when it can be combined with data from neighbouring countries.
This report draws on US Geological Survey.
Image: USGS · Public domain · via Wikimedia Commons.